How to make a ZIP code heat map in Excel
A ZIP code heat map can show where revenue, customers or workload are concentrated. The useful part is choosing what each color means. A map of total sales answers a different question from a map of sales per account, even when both start with the same spreadsheet.
Choose a filled map or a point heat map
People use “heat map” for two different displays. A filled map, also called a choropleth, gives each ZIP area a color based on a value. A point-density heat map blends nearby locations into hotspots. Use the first to compare named areas; use the second to explore concentrations of individual locations.
This guide covers an Excel filled map. It does not create street-level locations from ZIP codes or calculate driving time. For a list of customer locations, start with plotting ZIP codes on a map or use verified address coordinates.
1. Prepare one row per ZIP code
Keep the postal code, state and country in separate columns. Store postal codes as text: a code such as 02108 must keep its leading zero. Use a consistent reporting period and one row per ZIP before plotting. If the source has one row per sale, aggregate it first; if it has one row per account, count distinct account IDs before calculating a customer total.
| ZIP | Annual revenue (USD) | Active accounts | Revenue per account (USD) |
|---|---|---|---|
| 80202 | 120,000 | 12 | 10,000 |
| 80203 | 180,000 | 30 | 6,000 |
| 80204 | 60,000 | 20 | 3,000 |
| 80205 | 90,000 | 6 | 15,000 |
The postal codes are real; the business figures are invented for practice. The download is a summary table, not a set of customer coordinates or boundary polygons. Import the CSV through Excel's text/CSV import flow and review its column types before using your own data.
2. Decide whether color means total or rate
In the example, 80203 leads in total revenue at $180,000. 80205 leads in revenue per active account at $15,000. Neither result contradicts the other: one describes total business, while the other describes the average among six accounts.
For the sample's column order, divide revenue in D2 by active accounts in E2 with =IF(E2=0,"",D2/E2). Keep a missing or zero denominator separate from a measured zero result. Across all four ZIPs, the correct combined rate is $450,000 divided by 68 accounts, approximately $6,617.65 per account. Averaging the four ZIP rates would give a different and misleading overall figure.
3. Insert and check the Excel map
In an Excel version with Map charts, select the location fields and one numeric measure, then choose Insert → Maps → Filled Map. Check the matched locations before interpreting the colors. Add the state or country context if a location is ambiguous. Choose a numeric measure for a value scale; a text category produces category colors instead.
Microsoft's Map chart instructions cover supported versions and chart options. Creating or updating a Map chart requires an online connection. Filled Maps work with supported geographic regions, rather than street-address or latitude/longitude points.
4. Make comparisons consistent
- Keep the period visible. “Annual revenue, 2026” is more useful than “Sales heat map.”
- Keep units explicit. Dollars, account counts and hours need different labels.
- Check the legend. A dark ZIP should mean the same thing wherever it appears in the comparison.
- Distinguish no data from zero. A ZIP absent from the input has no reported value in this table; it is not automatically a zero-sales area.
- Inspect small denominators. Six customers can produce a volatile average. Retain the account-count column alongside the rate.
When comparing periods, use matching geographic coverage and review whether the color scale changed. An area can look darker because the scale changed even when its own value did not. Keep the underlying table with the map so reviewers can inspect exact values.
5. Move from a heat map to territory decisions
A high-value ZIP is not a complete sales territory. To design coverage, add customer locations, group adjacent areas, check workload and record ownership exceptions. In TerritoryKit, the built-in US boundary picker can load available five-digit Census ZCTAs. You can inspect accounts against those areas, compare numeric totals in Analytics and export membership for review.
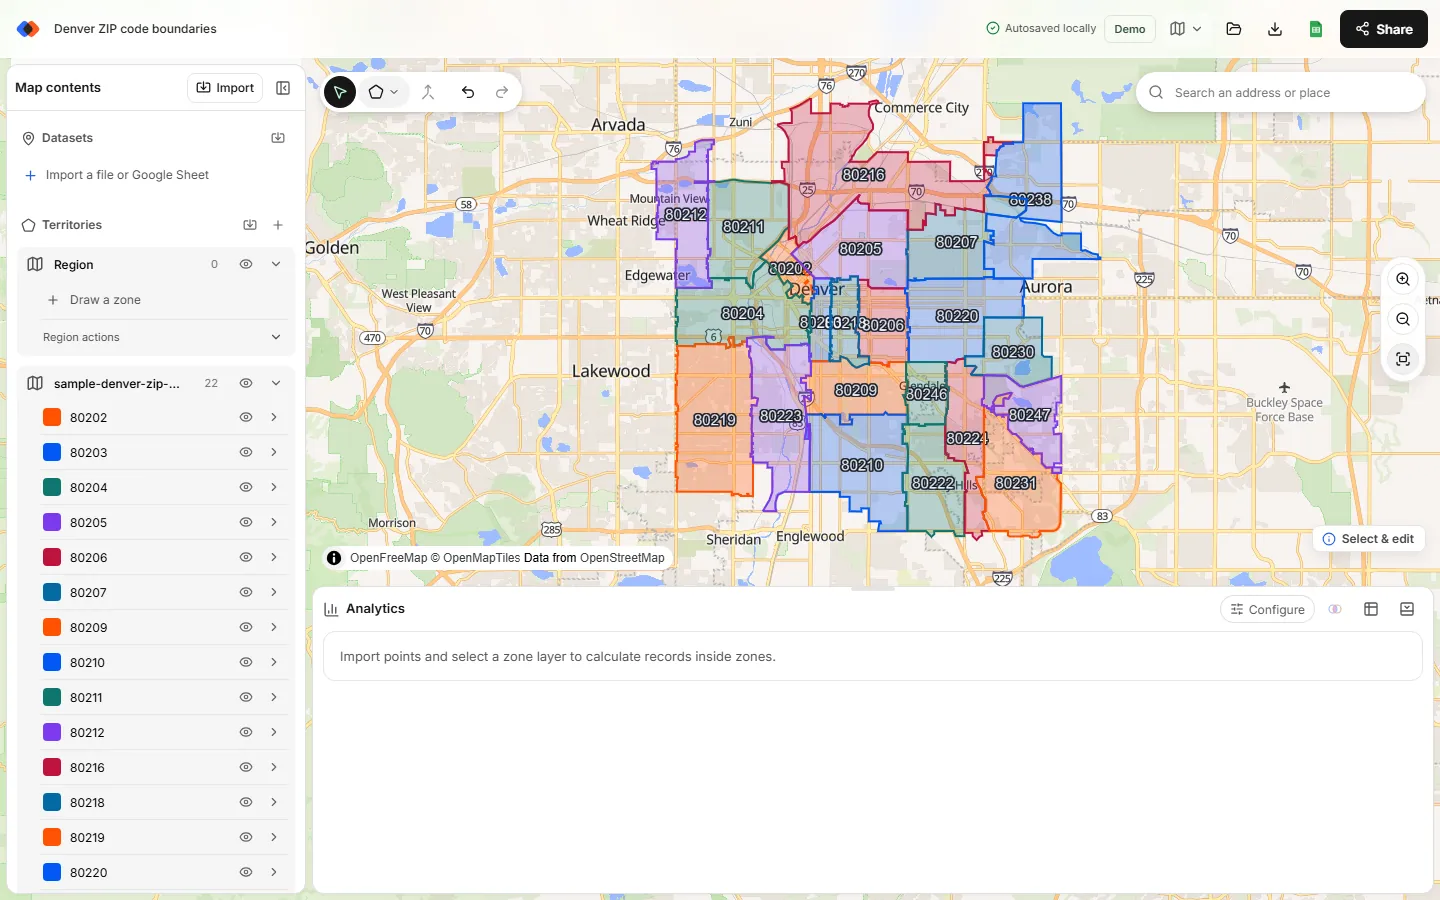
TerritoryKit's current workflow supports boundary styling and numeric territory analysis; it does not automatically turn this ZIP-summary CSV into a graduated-color choropleth. Use Excel for the filled-map display, and use ZIP-based territory mapping when you need editable boundaries and account assignments. Mapping point records requires coordinates or the supported US street-address matching flow.
For boundary-based analysis, remember that a Census ZCTA is an approximation of a ZIP's geographic distribution. The Census Bureau's ZCTA guidance explains the distinction. Do not assume a mailing ZIP and a polygon match every address exactly.
Before sharing the result
Confirm the source period, geographic matches, units, denominator and legend. Show a table beside any surprising hotspot, and check whether the result comes from one unusually large account. A useful map should tell a reviewer what happened in an area without hiding how the number was calculated.
FAQ
Can I make a ZIP code heat map without customer coordinates?
Yes, a filled map uses ZIP-level summary values. It does not locate individual customers. Exact customer mapping requires coordinates or address matching.
Why are some ZIP codes missing?
Check text formatting, leading zeros, state and country context, and whether the geography is supported. A missing area should not be reported as zero.
Is a ZIP heat map the same as a territory map?
No. A heat map colors areas by a measure. A territory map defines coverage and assignments; its areas may combine or split postal regions.
Can TerritoryKit automatically shade ZIPs using my CSV totals?
Not currently. You can style boundaries and compare account-level numeric totals in Analytics, but automatic choropleth coloring from ZIP-summary data is not available.
Related guides
Build your first territory map
Bring your account list, draw the territories you need, and see the results as the map changes. Your first map is free.
Open Map Builder