How to make a US sales regions map from Census regions
Many national sales teams split the country into a handful of regions before they assign a single rep. The U.S. Census Bureau's four regions and nine divisions are a common, recognizable starting point. This guide lists them, shows how to build a US sales regions map from them in a few minutes, and explains how to adjust the regions to fit your team.
Quick answer
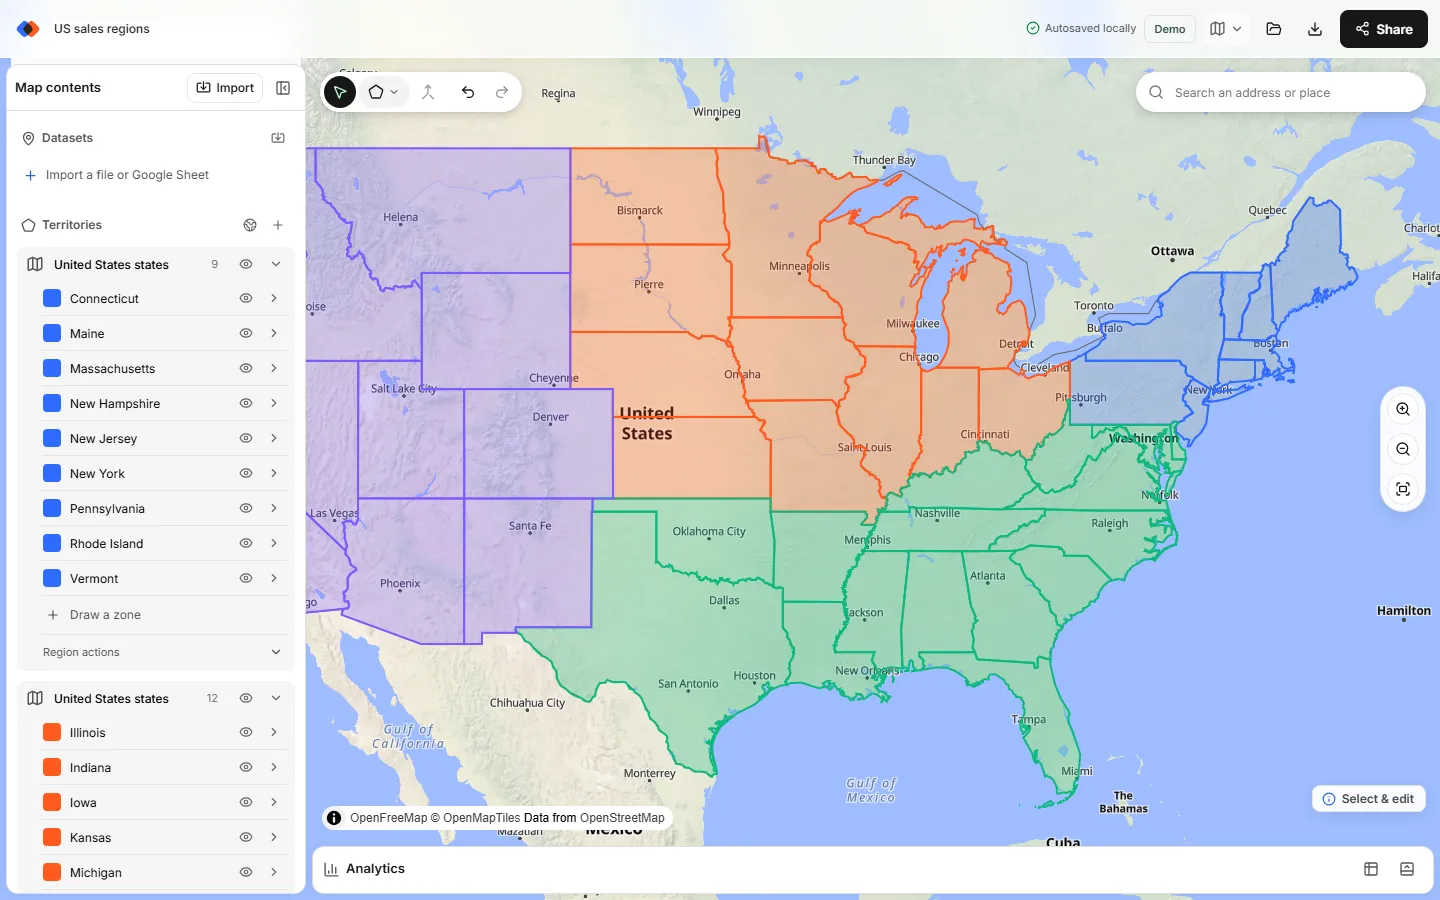
To make a US sales regions map, open the map builder and choose Territories → Add boundaries. Pick United States with the States and counties boundaries and set Territories from to States. Click the Northeast chip, select Add 9 states, and rename the new region “Northeast”. Repeat for Midwest, South and West, then give each region's states one color. Every state stays an editable zone, so you can adjust the regions later and count accounts in each one.
- Built-in boundaries. US states and counties come from Census cartographic boundaries. Nothing to download or upload, and no account needed to build the map.
- One click per region. Quick-pick chips select the Northeast, Midwest, South, West or Territories.
- Custom regions too. Start from a chip, then check or uncheck states before adding.
The four US Census regions and nine divisions
The Census Bureau groups the 50 states and the District of Columbia into four regions, which it splits into nine divisions. The grouping is widely documented and used across federal statistics, so a territory map by region built on it lines up with public data on population, households and businesses.
| Region | Division | States |
|---|---|---|
| Northeast | New England | Connecticut, Maine, Massachusetts, New Hampshire, Rhode Island, Vermont |
| Northeast | Middle Atlantic | New Jersey, New York, Pennsylvania |
| Midwest | East North Central | Illinois, Indiana, Michigan, Ohio, Wisconsin |
| Midwest | West North Central | Iowa, Kansas, Minnesota, Missouri, Nebraska, North Dakota, South Dakota |
| South | South Atlantic | Delaware, District of Columbia, Florida, Georgia, Maryland, North Carolina, South Carolina, Virginia, West Virginia |
| South | East South Central | Alabama, Kentucky, Mississippi, Tennessee |
| South | West South Central | Arkansas, Louisiana, Oklahoma, Texas |
| West | Mountain | Arizona, Colorado, Idaho, Montana, Nevada, New Mexico, Utah, Wyoming |
| West | Pacific | Alaska, California, Hawaii, Oregon, Washington |
Puerto Rico, Guam, the U.S. Virgin Islands and the other territories aren't part of any Census region. TerritoryKit puts them under a separate Territories chip so you can add them to whichever sales region serves them.
Why use Census regions for regional sales territories
- Everyone recognizes them. “Midwest” and “Pacific” need no explanation in a board deck.
- They match public data. Census and other federal statistics are often published by region and division, which helps when you size markets or set quotas.
- They nest. Divisions fit inside regions, so a manager can own a region and team leads its divisions.
They aren't balanced, though. The South has 16 states plus DC, the Northeast 9 much smaller ones, and population, accounts and travel time differ widely between regions. Treat Census regions as a starting draft, not a finished design; sales territory design covers what to weigh.
Build the four regions step by step
Open Add boundaries
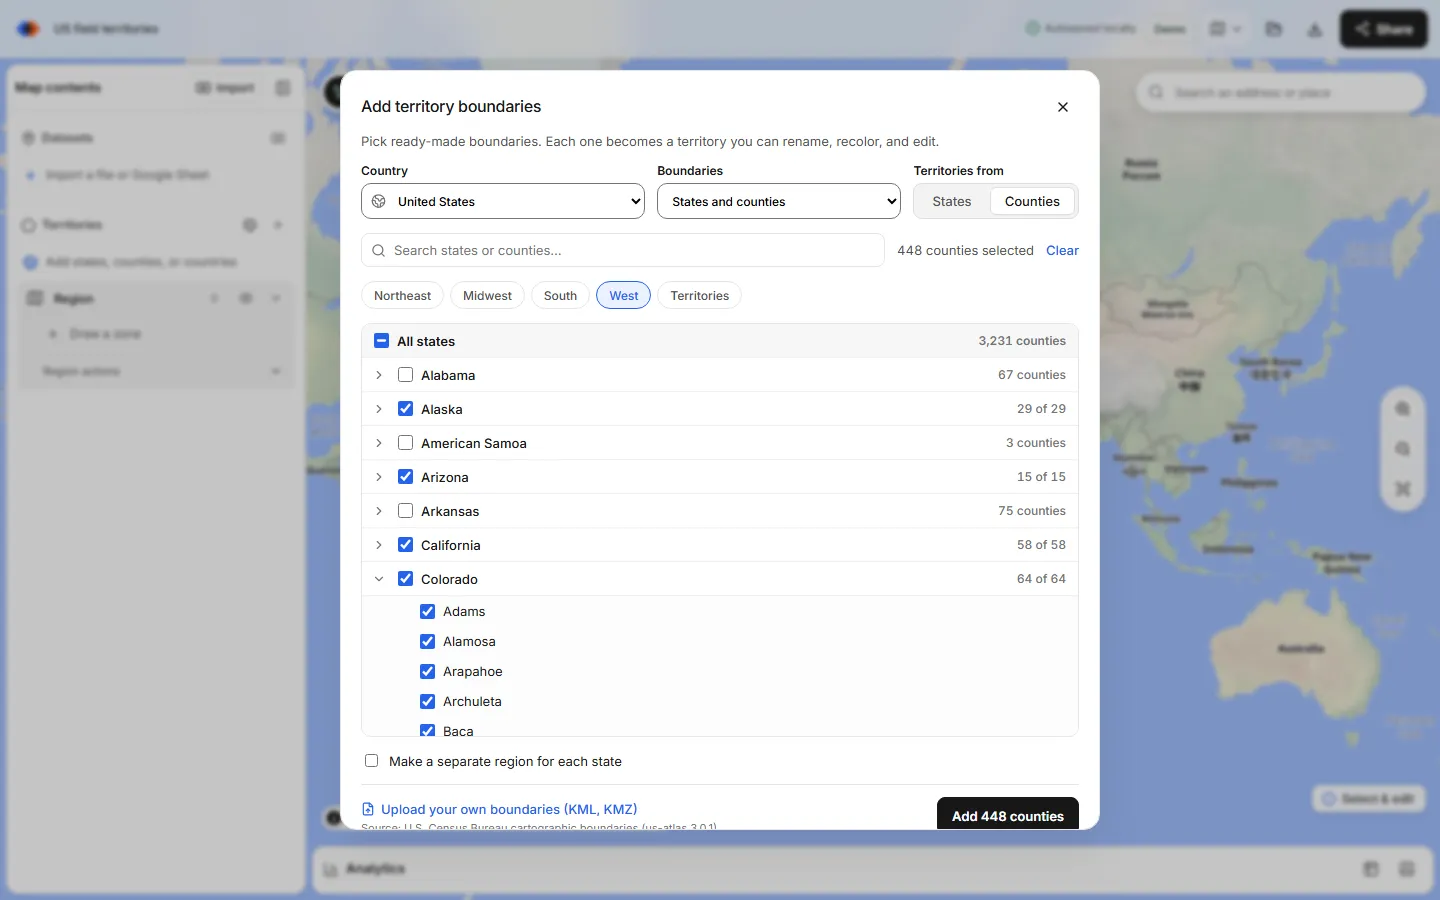
In the map builder, open the Territories panel and choose Add boundaries, the globe button. In the Add territory boundaries dialog, pick United States and keep States and counties under Boundaries.
Set Territories from to States
Choose States so each state becomes one zone. The other option, Counties, lists every county under its state, which is useful when a region needs part of a state.
Click a region chip
Click Northeast. All nine Northeast states are checked. To customize the region, check or uncheck states in the list before you add; the chip shows a mixed state when only some of its states are selected.
Add and rename the region
Select Add 9 states. The states arrive as a new region in the Territories panel, one zone per state, named after the state. Change the region name to “Northeast”.
Repeat for Midwest, South and West
Open Add boundaries again for each remaining region, clear the previous selection, click its chip, add and rename. Four adds give you four regions: Northeast, Midwest, South and West.
Give each region one color
Each state arrives in its own color. Set every state in a region to that region's color, for example blue for the Northeast and green for the Midwest, so the four regions read clearly at national scale.
Add the nine Census divisions
There are no chips for divisions, but the table above gives you the state lists. Build them the same way: one add per division, checking its states by hand, then rename the region after the division. Quick tip: click the region chip first, then uncheck the states that belong to the other division.
You can keep both levels on one map. Build a set of four region layers and a set of nine division layers, then turn layers on or off in the Territories panel depending on whether you're presenting to leadership or to a division team.
Two ways to structure a US sales regions map
The steps above keep each state as its own zone inside a region. The alternative is to merge each region's states into one shape. Both work; they trade off differently.
| Structure | How you build it | Good for | Trade-off |
|---|---|---|---|
| One region per sales region, states as zones | One Add boundaries per region, as in the steps above | Clean outlines; state-by-state counts with a total for the region in Analytics | Compare regions by switching the region in Analytics; a state can't be moved into another region later, so rebuild that region instead |
| Merged shapes in one region | Add all states at once, select a region's states, then Merge selected zones | One Analytics table with a row per merged shape | Only areas that touch merge into one shape; islands, Alaska and Hawaii become separate pieces |
Customize the regions for your team
Few teams use the Census lines unchanged. Common edits:
- Move a border state. Texas often gets its own region, and Missouri or Kentucky may sit better with a neighbor. Because zones can't be moved between regions, decide before you add: start from the chip, uncheck the state, and include it in the region that should own it.
- Split a state. When a region needs part of a state, such as Northern and Southern California, set Territories from to Counties and check that state's counties instead of the whole state. Territory maps by state or county covers county-based territories. For a one-off split, select the state zone and use Line cut: draw a line across it that starts and ends outside the state, then press Enter.
- Use ZIP prefixes instead of states. The 3-digit ZIP codes boundary set has the same Census region chips, so you can build regions from 896 prefix areas that follow metro areas more closely than state lines. See how to make a 3-digit ZIP code map.
- Add metro detail. For a city that needs its own territory, look up its 5-digit ZIP codes, up to 50 at a time, as a separate region; the ZIP code map maker guide shows how.
Compare regions with your own data
Import your accounts as CSV, Excel or a Google Sheet. Rows with latitude and longitude plot directly, and up to 1,000 US street addresses per import can be matched with Find coordinates from addresses. Open Analytics, choose the accounts under Dataset and a region under Territories. You see accounts per state zone, a total for the region, an optional breakdown by a category such as segment, and sums of a number column with Measure → Sum of. Switch the Territories choice to compare the next region, or export metrics as CSV or XLSX to put all four side by side in a spreadsheet.
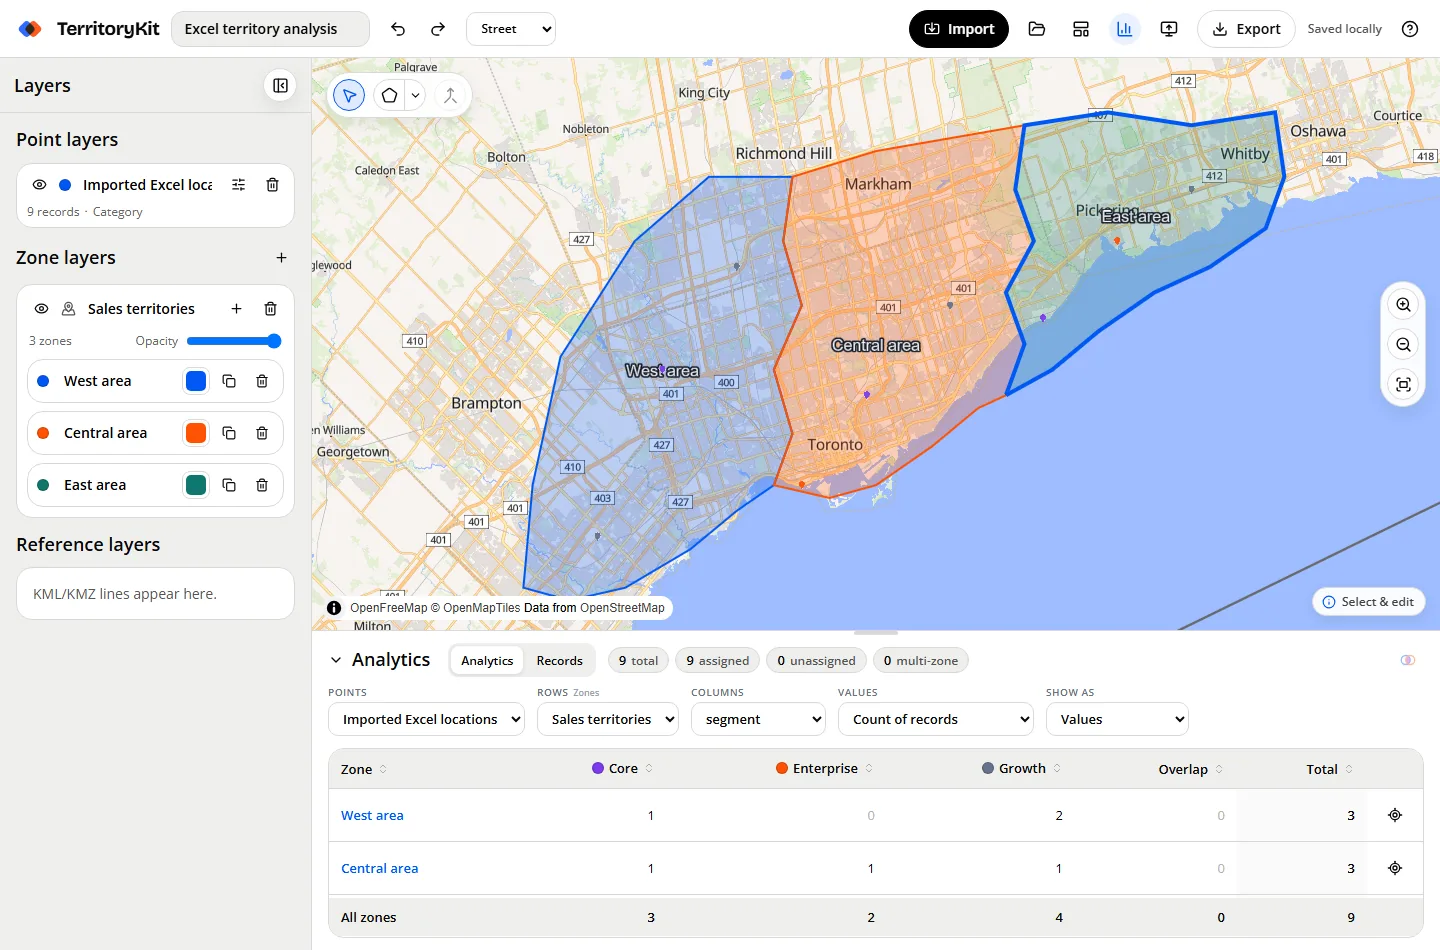
TerritoryKit doesn't balance regions automatically or suggest new boundaries. If one region carries far more accounts or revenue than the others, adjust the state lists by hand and compare again; how to balance sales territories walks through the method. To write the region back onto each account, export point membership and follow assign accounts to territories.
Share and present the regions map
Show region names as labels and add a legend so the colors explain themselves; see add labels and a legend. Presentation mode hides the editing tools for a meeting. To let managers look or edit, invite named viewers, editors or admins, which is free on both plans; share an interactive territory map explains the roles. Changes are saved as revisions, without simultaneous live editing. Sign in to export a PNG, a print/PDF, or the regions as GeoJSON or KML; the Demo plan includes 10 exports in total and Pro, at US$19 a month, has no limit.
Regions outside the United States
The same picker has quick-pick chips for other countries' regions, such as Japanese regions and Spanish autonomous communities, and boundaries for about 215 countries and territories. For a world or multi-country plan, see the international sales territory map guide.
FAQ
What are the four US Census regions?
Northeast, Midwest, South and West. The Census Bureau splits them into nine divisions: New England and Middle Atlantic; East North Central and West North Central; South Atlantic, East South Central and West South Central; Mountain and Pacific.
How many states are in each Census region?
The Northeast has 9 states, the Midwest 12, the South 16 plus the District of Columbia, and the West 13. Puerto Rico and the other territories aren't in any region.
How do I make a sales region map of the US?
In TerritoryKit, choose Territories → Add boundaries, pick United States and States, click a Census region chip, add the states and rename the new region. Repeat for each region and give each one a color.
Can I create custom sales regions instead of Census regions?
Yes. Start from a region chip or an empty selection, check exactly the states you want, and add them as one region. To use part of a state, select counties instead of states.
Can I count customers or revenue per region?
Yes. Import your accounts with coordinates or US street addresses, open Analytics and pick a region under Territories. You get counts per state, a region total and sums of a number column such as revenue.
Can TerritoryKit balance regions automatically?
No. TerritoryKit shows counts and totals per region so you can compare them, but you adjust boundaries by hand. See how to balance sales territories.
Related guides
Build your first territory map
Bring your account list, draw the territories you need, and see the results as the map changes. Your first map is free.
Open Map Builder