How to create a territory map
Create a territory map in your browser from coordinate-ready locations and custom or imported boundaries.
Try a territory map with sample data
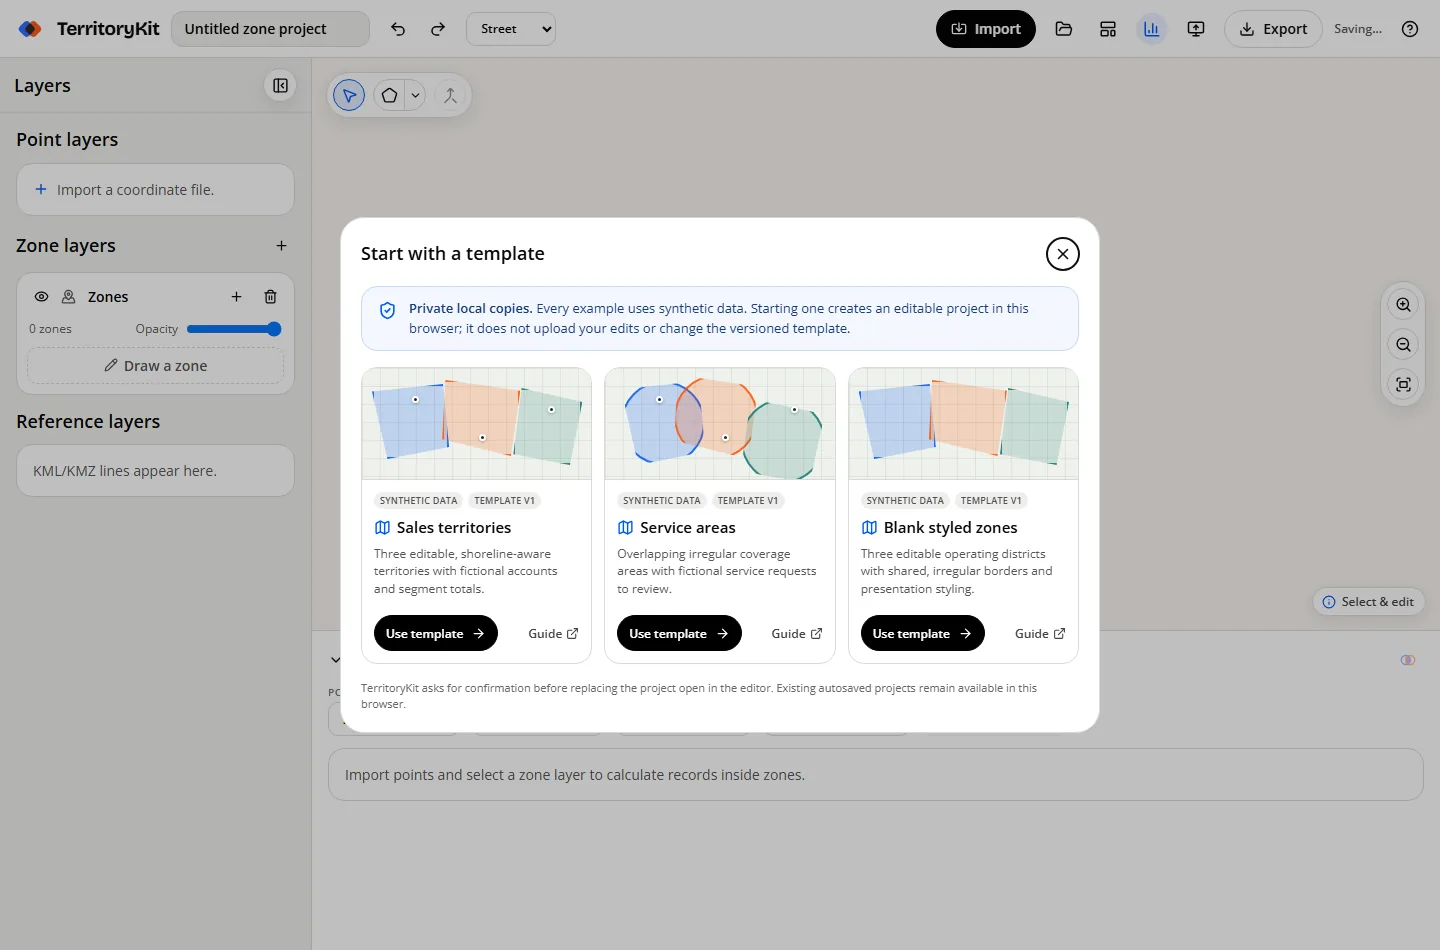
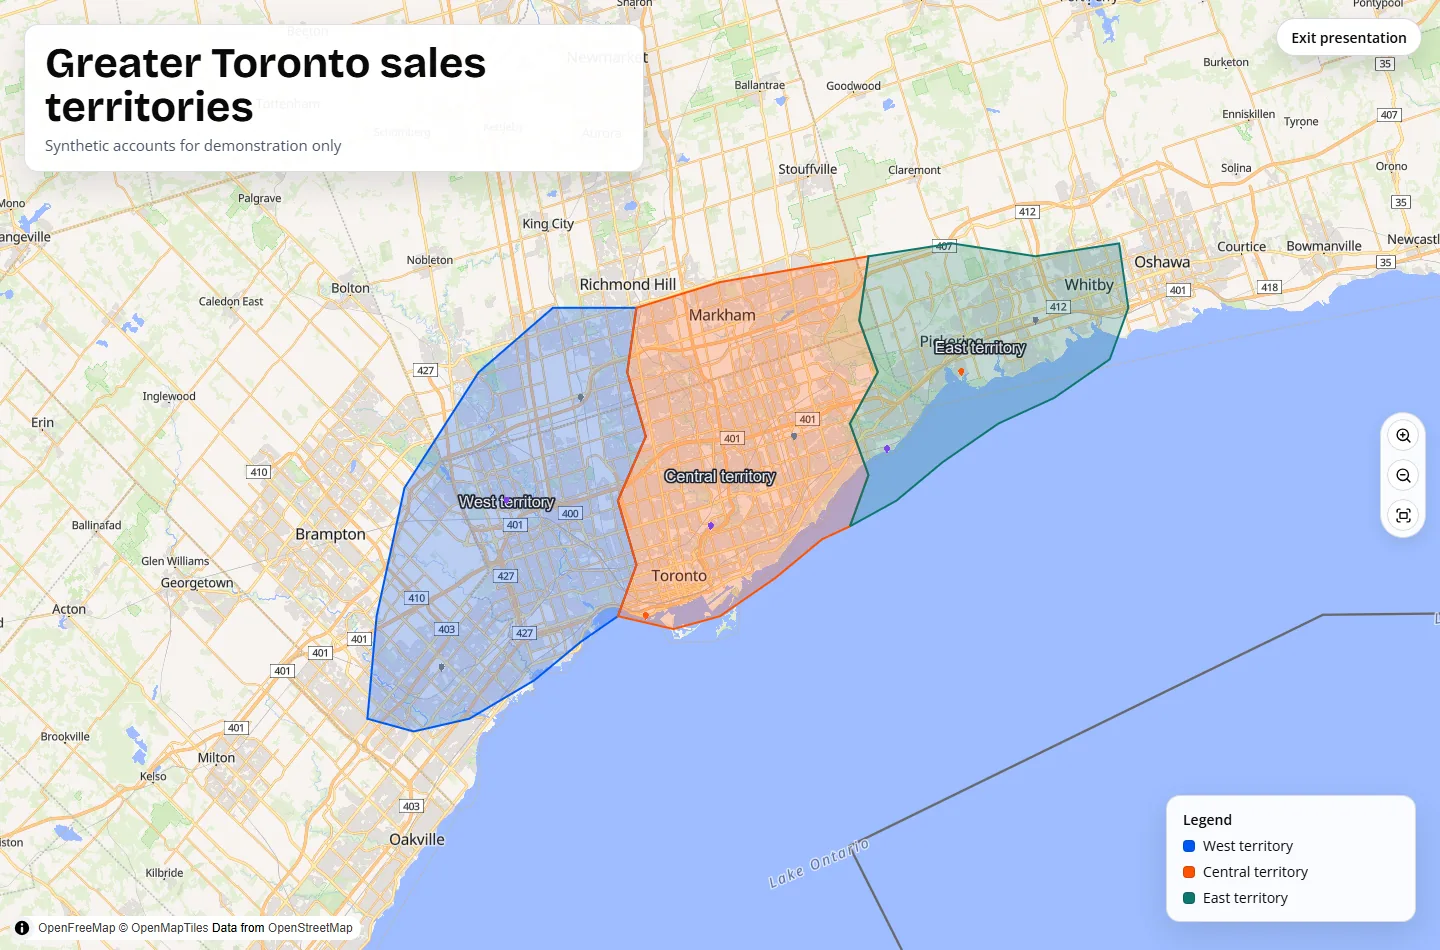
Start with the sales territory starter project to explore a completed map. It includes synthetic accounts and editable zones. Select a zone, change its boundary, and compare its count before and after the edit. This makes the connection between a territory shape and its assigned locations visible.
For a blank project, download the sample below, select Import, and map the latitude and longitude columns. Use the polygon tool to draw around a small group of points, then open Analytics and select your point and zone layers.
Check your first result
- A location inside one zone should have one territory membership.
- A location in two overlapping zones is included in both zone totals; adding those totals can double-count locations.
- A location outside every zone is unassigned. Check these records before exporting.
- Points on a boundary count as inside. A point on a shared border can therefore belong to both territories.
Use Present map for a labeled PNG or browser print/PDF. Use Export → Project backup when the recipient needs to reopen and edit the project. A map image is a presentation file, not an editable backup.
When to use this
Use this workflow when you need editable sales regions, service areas, operating zones or research boundaries without a cloud GIS workspace.
Step-by-step workflow
Start blank or use a synthetic template
Open the map builder, or use the blank styled zones template to learn with a private local copy.
Import location data
Import CSV, XLSX or XLS rows with latitude and longitude. KML and KMZ can add existing points, zones or reference lines.
Draw or edit territories
Create polygon or circle zones, then rename, recolor, reshape, duplicate, merge or split them.
Review the data
Use Analytics for zone totals and overlaps. Use Records to search, filter, sort and focus individual points.
Present and export
Add labels, a legend and map heading, then download PNG, print to PDF, or export data and geometry formats.
Supported formats and inputs
- Point imports: CSV, XLSX and XLS with coordinate columns.
- Spatial imports: KML and KMZ; portable TerritoryKit project JSON is also supported.
- Visual outputs: PNG at 1×, 2× or 4× and browser print/PDF.
Tips and common mistakes
- Use the import repair summary before accepting spreadsheet rows.
- Keep zone names short enough to work as map labels and legend entries.
- Export a project backup before clearing browser site data or moving devices.
Export and results
Export visual maps, metrics, filtered records, point membership, KML, GeoJSON or a full editable project backup. Project data remains in your browser unless you download and share a file.
FAQ
Can I make a territory map for free?
Yes. The current builder uses browser-only features and does not require an account.
Do I need GIS software?
No. TerritoryKit provides the current import, drawing, analysis and export workflow in a desktop browser.
Can I continue later?
Yes. Meaningful edits autosave in the current browser profile, and you can also export a portable backup.
Related workflows
Build your first territory map
Bring your coordinates, draw the zones you need, and see the results as the map changes.
Open Map Builder